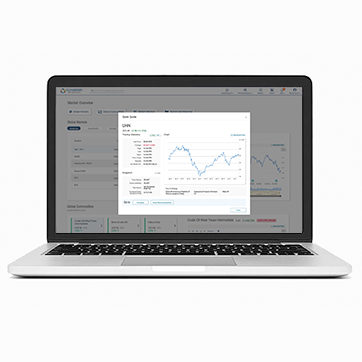
UX Case Study / SR.com Market Overview
Challenge
The head of publishing came to the product team to gain insight on why we don’t have a market overview page.
Approach
Online research, Internal Focus Group
Role, scope, and constraints
What was your role? UX Lead
What was the timeline of the project? 2 months
What were the platforms or constraints? This project had a very tight turnaround time as we saw a lot of value in an overview page to help out users gauge the market.
Results
Utilizing the feedback and research from above I was able to quickly provide LF wireframes to confirm the feature, functionality, and data that would be shown.
The Research and Process
The Process
Our UX process took a step forward in this project so the process was better defined, implemented, and reflected how the team envisioned a UX project should be done.
With this project the following process was used:
Understand: I used internal focus groups to understand the challenges and the type of data I needed to account for in the UI.
Research: Analyzed internal data capabilities to determine what streams we could get, documented several other market overview pages for features, data, and interactions.
Design: Used data and UI research to develop several LF concepts and presented them to C-Suite and Platform Owner for approval.
Rinse and Repeat: Using the feedback from the focus groups we further refined the acceptance criteria and design in tandem with development cycles.
The Research
What did you do?
I lead conversations with internal SMEs and dev team focus groups to understand what the requirements were for the page, how we could best utilize our datasets, and how to best group them.
Using online resources also reinforced internal design decisions with the focus group.
What was the result?
We were able to come to a 1st iteration of the market overview that included a lot of mandatory data for our B2C and B2B users. There are plans to expand on our data set to include Cost of Living, Inflation, and Crypto. The UI is built to be flexible to expand to larger data sets.


